Loading...
Loading...
Loading...
Loading...
Loading...
Loading...
Loading...
Loading...
Loading...
Loading...
Loading...
Loading...
Loading...
Loading...
Loading...
Loading...
Loading...
Loading...
Loading...
Loading...
Loading...
Loading...
Loading...
Loading...
Loading...
Loading...
Easy Draw is an easy to use Python and Java module that allows you to create simple graphics primitives (rectangles, circles, polygons, etc.) with just method calls.
It is designed to be used with students that only know how to make function/method calls with Python or Java code.
After learning more about coding (conditionals, iteration, and procedural definitions), students can use Easy Draw to make simple animations and games!
Coming soon...
Visit the GitHub page to file an issue or contribute to the project!
Python:
Java:
Coming soon...
Easy Draw was created by , Computer and Software Engineering instructor at William M. Davies, Jr. Career and Technical High School in Lincoln, Rhode Island.
The project was created to introduce Davies' students to GUI development early in an introductory Python course. Then, I thought it would be great to use in AP Computer Science A (Java)! GUIs are how students interact with software. Let's get them to build GUIs earlier and generate more interest in Computer Science and programming!
Looking for a simple way to create an app with Python or Java? Check out the Easy App project:
For more information about Davies Career and Technical High School, visit
Like what Joe created? ☕ Buy him a coffee:
Coming soon!
Coming soon!
Email me at [email protected] if you want to help!
Coming soon!
Coming soon!
To open the Easy Draw screen, all you need is three lines of code. It is that easy!
# Learn how to use Easy Draw!
# https://easy-draw.joemazzone.net/python/module-reference

import easy_draw           # Import the module to use it

easy_draw.load_canvas()    # Always start your program with this

# --- Your main program below here ---


# --- Your main program ends here ---

easy_draw.end()            # Always end your program with this
The following will open when you run the above program:
1. Grid on and off
To help learners visualize the coordinate system, a grid can be turned on and off.
2. Coordinates
To help learners position shapes on the drawing canvas, as you move your mouse around the canvas the bottom-right corner of the screen showcases the x, y coordinates of your mouse.
3. Color Picker
To help learners identify color values to use in their code, they can launch a color picker from the Easy Draw window.
Note: The color picker is native to the operating system and will look different on different systems.
4. Save the Canvas Drawing
You can save your drawing as a PNG file by clicking the "Save Canvas" button. Just be sure to provide the image with a file name. The image will save in your project's current working directory (most likely the same folder as your code).
You can save your drawing as a PNG file by clicking the "Save Canvas" button. Just be sure to provide the image with a file name. The image will save in your project's current working directory (most likely the same folder as your code).
save_canvas() FunctionIf you want to programmatically save the canvas, you can use the save_canvas() function.
The function does launch the a dialog to enter the file's name.
If you want to use the save_canvas() function without launching the dialog each time, you must provide a file name to save the image as.
The image file will save as a .png
.rotate(angle) Rotates an Easy Draw object by a specified amount of degrees.
Positive numbers rotate the shape clockwise (to the right). Negative numbers rotate the shape counter-clockwise (to the left).
Example:
rect1.rotate(45)Unsupported objects: Image
.erase()Deletes the object from the canvas. Once erased, an object can no longer be referenced.
Example:
Unsupported objects: None
.to_string()Returns the string representation of the object. The string will include the object type and ID number used by Easy Draw.
Example:
Unsupported objects: None
For information on the .set_property() method see:
For information on the .event_setup() method see:
All shapes will be drawn on a canvas.
The Easy Draw canvas is 600 x 600 pixels (600 pixels wide by 600 pixels tall). So (300, 300) is the middle of the canvas, and (600, 600) is the bottom-right corner.
The coordinate system origin (0, 0) is the top-left corner of the canvas.
As x increases, objects move right. As y increases, objects move down (not up!).
.
Coming soon!
Coming soon!
rect1.erase()print(rect1.to_string())Jacob Turchetta, Davies Career and Technical High School, Class of 2023 -- Python Module
Arianna White, Davies Career and Technical High School, Class of 2023 -- Python Module
Rodilson Borges, Davies Career and Technical High School, Class of 2023 -- Python Module
Emma Ainsburg, Davies Career and Technical High School, Class of 2023 -- Python Module
David Cabreja, Davies Career and Technical High School, Class of 2023 -- Python Module
Noah Campanelli, Davies Career and Technical High School, Class of 2023 -- Python Module
Victoria DeLaCruz, Davies Career and Technical High School, Class of 2023 -- Python Module
Jonathan Picon Ruiz, Davies Career and Technical High School, Class of 2023 -- Python Module
Daunte Costa, Davies Career and Technical High School, Class of 2023 -- Python Module
Ethan Wijerathnayapa, Davies Career and Technical High School, Class of 2023 -- Python Module
load_canvas()Load canvas has one optional argument - background. The background property allows you to identify a color value for the canvas on load.
Example:
set_canvas_color(color)
Used to change the canvas background color at any point in the program.
Example:
end()
Every Easy Draw program must end with this function call. It sets up the event loop and allows the window to remain open on the desktop.
easy_draw.load_canvas(background = (255, 0, 0))easy_draw.set_canvas_color(color = (0, 0, 255))easy_draw.save_canvas()easy_draw.save_canvas("my_pic")easy_draw.end()object.property_name
To get any property from an Easy Draw object, simply use the variable name of storing the object dot the name of the property.
Example: Getting the radius property from a Regular Polygon object named pentagon
Example: Getting the color property from a Text object named title
object.set_property(property_name = new_value)
To set a property to a new value, you must call the .set_property() method on the object you want to change, identifying the property you want to change and its new value.
Example: Changing the text property of a Text object named title
Example: Changing the width property of a Rectangle object named box
In this example we will create a square with a random color and an octagon with default color, "black". Whenever the octagon is clicked, its color will change to the square's color.
To do this, we need to get the color property of the square and set the color property of the octagon.
Get the square's color property -- square.color
Set the octagon's property -- octagon.set_property()
In this example, we create a growing circle by increasing the circle's radius by 10 each time it is clicked.
Notice how the Circle object's radius property is set to the current cir.radius plus 10.
Easy Draw is not on PyPI just yet, so you cannot pip install it. To use it you will need the easy_draw.py file which can be found and downloaded from GitHub.
Once you have the easy_draw.py file, you can include it in your project directory (the same folder as your project files).
The first and most important dependency required to use Easy Draw is Tkinter. Tkinter is a standard Python GUI toolkit. It should be installed on your system if you have Python installed as it is part of the standard distribution.
It you get an error like the following:
You may need to install Tkinter on your system.
The second dependency required to use Easy Draw is PIL. PIL stands for Python Imaging Library and is a very popular library used to work with image file with Python code.
If you get an error like the following:
You may need to install PIL on your system.
pentagon.radius
title.colortitle.set_property(text = "Player 1 has selected a character...")box.set_property(width = 200)import easy_draw
import random
easy_draw.load_canvas()
square = easy_draw.Rectangle(
xy = (100, 100),
width = 200,
height = 200,
color = random.choice(["blue", "red", "yellow", "green", "orange", "purple"])
)
octagon = easy_draw.RegPolygon(
center_xy=(400,400),
radius=100,
nsides=8
)
def click_octagon(event):
global square
global octagon
octagon.set_property(color = square.color)
square.event_setup("<Button-1>", click_octagon)
easy_draw.end()import easy_draw
easy_draw.load_canvas()
cir = easy_draw.Circle(
center_xy = (300, 300),
radius = 20
)
def click_circle(event):
global cir
cir.set_property(radius = cir.radius + 10)
cir.event_setup("<Button-1>", click_circle)
easy_draw.end()ImportError: No module named tkinterImportError: No module named PILText(center_xy, text)
Property
Default Value
Description
Example:
First thing that need to be done to use an image is open it in Easy Draw with the open_image() function.
The open_image() function requires 1 positional argument - filename. The filename can be relative or an absolute file path.
Then you can create an image object.
Image(center_xy, image)
Example:
There are 3 ways you can use colors in Easy Draw:
The easiest way to represent an color is by using the color's name in a string.
Examples:
Here is a list of many of the colors Easy Draw supports.
You can define a color as a tuple with 3 color values representing red, green, and blue. This is know as “RGB”. RGB stands for Red, Green, and Blue. We specify how much red, green, and blue to use by a number range of 0-255. No light is zero. Turn the light on all the way on and it is 255. We need three numbers to specify three colors, so (0, 0, 0) means no red, no green, no blue -- Black.
Here are some other examples:
Examples:
Hex color values represent color in the same way as RGB, but instead of decimal (base 10) number values they use hexadecimal (base 16) values.
A hexadecimal color is specified with: #RRGGBB.
RR (red), GG (green) and BB (blue) are hexadecimal integers between 00 and FF specifying the intensity of the color.
For example, #0000FF is displayed as blue, because the blue component is set to its highest value (FF) and the others are set to 00.
Examples:
To make it easy to discover colors, Easy Draw comes with a built in color picker.
It will look different on different operating systems.
But when you select a color, it will display the Hex and RGB value for you to record and use in your program.
Easy Draw supports all Tkinter events. Here is a detailed list if event formats:
<Button-1>
A mouse button is pressed over the widget. Button 1 is the leftmost button, button 2 is the middle button (where available), and button 3 the rightmost button. When you press down a mouse button over a widget, Tkinter will automatically “grab” the mouse pointer, and subsequent mouse events (e.g. Motion and Release events) will then be sent to the current widget as long as the mouse button is held down, even if the mouse is moved outside the current widget. The current position of the mouse pointer (relative to the widget) is provided in the x and y members of the event object passed to the callback.
You can use ButtonPress instead of Button, or even leave it out completely: <Button-1>, <ButtonPress-1>, and <1> are all synonyms. For clarity, I prefer the <Button-1> syntax.
<B1-Motion>
The mouse is moved, with mouse button 1 being held down (use B2 for the middle button, B3 for the right button). The current position of the mouse pointer is provided in the x and y members of the event object passed to the callback.
<ButtonRelease-1>
Button 1 was released. The current position of the mouse pointer is provided in the x and y members of the event object passed to the callback.
<Double-Button-1>
Button 1 was double clicked. You can use Double or Triple as prefixes. Note that if you bind to both a single click (<Button-1>) and a double click, both bindings will be called.
<Enter>
The mouse pointer entered the object (this event doesn’t mean that the user pressed the Enter key!).
<Leave>
The mouse pointer left the object.
<FocusIn>
Keyboard focus was moved to Easy Draw.
<FocusOut>
Keyboard focus was moved from Easy Draw to another Window.
<Return>
The user pressed the Enter key. You can bind to virtually all keys on the keyboard. For an ordinary 102-key PC-style keyboard, the special keys are Cancel (the Break key), BackSpace, Tab, Return(the Enter key), Shift_L (any Shift key), Control_L (any Control key), Alt_L (any Alt key), Pause, Caps_Lock, Escape, Prior (Page Up), Next (Page Down), End, Home, Left, Up, Right, Down, Print, Insert, Delete, F1, F2, F3, F4, F5, F6, F7, F8, F9, F10, F11, F12, Num_Lock, and Scroll_Lock.
<Key>
The user pressed any key. The key is provided in the char member of the event object passed to the callback (this is an empty string for special keys).
a
The user typed an “a”. Most printable characters can be used as is. The exceptions are space (<space>) and less than (<less>). Note that 1 is a keyboard binding, while <1> is a button binding.
<Shift-Up>
The user pressed the Up arrow, while holding the Shift key pressed. You can use prefixes like Alt, Shift, and Control.
Each of these events have useful properties that can be retrieved in the event handler function:
x, y
The current mouse position, in pixels.
x_root, y_root
To create an event handler, you simply just create a function definition and provide it with event as a parameter. Inside the definition, you provide the statements you wish to be executed when the event is triggered.
Example:
object.event_setup(event, handler)
To attach or bind an event and handler to an Easy Draw object you must use the .event_setup() method and provide the event name and handler function name as parameters.
Example: Bind a <Button-1> event with handler named click_octagon to the object stored in octagon.
canvas_event_setup(event, handler)
To attach or bind an event and handler to the entire Easy Draw canvas you must use the canvas_event_setup() function and provide the event name and handler function name as parameters.
It is recommended to bind keyboard events to the entire canvas instead of binding key events to a specific object.
Example: Bind a <Up> arrow key event with handler named move_up .


The documentation will show examples a certain way, but it doesn't mean you have to write your code that way.
I have designed the documentation for what I believe is best for beginner students to work with the module and learn certain concepts.
Below I outline some examples of this:
In all examples Easy Draw is imported the following way:
This mean in order to use any of the Easy Draw commands, you need to use the module name and a dot operator.
color = "red"
color = "green"
color = "blue"
color = "white"
color = "black"
The current mouse position relative to the upper left corner of the screen, in pixels.
char
The character code (keyboard events only), as a string.
keysym
The key symbol (keyboard events only).
keycode
The key code (keyboard events only).
num
The button number (mouse button events only).
type
The event type.
easy_draw.load_canvas()My philosophy: It is best practice to have students work with modules using full module name first, but it does not prevent you for doing the following examples.
It is possible to indiscriminately import everything from a module at one fell swoop. This is called a wildcard import and it is done like this from module import * . It makes it so you do not need to reference the module to use its commands. See below:
Yes, the code is much less complex looking now. However, this is not Python best practice and wildcard imports should be avoided according to PEP 8. I want students to know they are working with a module and not abstract that experience too much.
You can also nickname the module when importing so you do not have to type easy_draw each time. You do this by using the import module as nickname structure.
I have done this with modules before and students seem to get confused about what the module's actual name is. Then when they come across code online that doesn't nickname the way they expect, they are confused. So, I only show this trick later on when they are more experienced or when a student asks "do I really have to type easy_draw each time?"
In the examples you will notice that the object constructor functions are stylized to have each argument (property value) on separate lines:
I have students stylize the constructor method calls this way so it is easier for them to see the individual property values of the object they are instantiating.
Of course you can put these values all on one line which is the typical way to call functions and pass argument values.
You may also notice that each example explicitly states the instance variable (property) name when assigning it a value in the constructor function call. I use this practice to help students learn the parameter needed to construct the object. Previous to doing this students would plug in values and not really know what the value was for. Explicitly using the name ensures the student knows what each value is used for. Example:
But, of course, you can use positional arguments and provide the values in the order the constructor function expects them. Rectangle(xy, width, height)
However, the optional properties of an object (like color) are not positional arguments. These properties are keyword arguments and need to use the instance variable (property) name to set the value.
All constructor functions start with a capital letter and use CamelCasing.
Examples: Rectangle(), Oval(), Text(), RegPolygon()
All other functions and instance variables/property names use all lowercase letters and snake_casing.
Examples: load_canvas(), color, .rotate(), border_width
All examples show objects being stored in a variable. If you want to be able to use a method on an object or change a property of that object, you must store it in a variable to reference the object later. So, all examples show objects being stored and referenced from a variable.
The above example shows the Rectangle object is stored in a variable named square. Because it stored in a variable, we can use the .rotate() method on it.
However, the shape will be drawn without storing the object in a variable.
If you try the above, it still creates the square.
You can call methods on an object without storing it in a variable by immediately following the constructor function call with the method call.
OR
Lots of shape drawing and game Python libraries will require x and y coordinates as separate values. I have found that students see these values as a pair, so Easy draw objects expect x and y coordinate to be coupled as a tuple.
Example: This -- xy =(100, 200) | Not this -- x = 100, y = 200
However, the points_list for Polygon and Line must be pairs of x and y (an even amount of numbers) but not in tuples, simply just listed:
Example:
This -- points_list = [50, 210, 180, 250, 300, 210]
Not this -- points_list = [(50, 210), (180, 250), (300, 210)]
def click_octagon(event):
    global octagon
    color = random.choice(["blue", "red", "yellow", "green", "orange", "purple"])
    octagon.set_property(color=color)
    octagon.rotate(10)

octagon.event_setup("<Button-1>", click_octagon)octagon.event_setup("<Button-1>", click_octagon)easy_draw.canvas_event_setup("<Up>", move_up)import easy_draw
easy_draw.load_canvas()
square = easy_draw.Rectangle(
    xy = (100, 100),
    width = 200,
    height = 200
)
easy_draw.end()from easy_draw import *
load_canvas()
square = Rectangle(
xy = (100, 100),
width = 200,
height = 200
)
end()import easy_draw as ed
ed.load_canvas()
square = ed.Rectangle(
xy = (100, 100),
width = 200,
height = 200
)
ed.end()square = easy_draw.Rectangle(
xy = (100, 100),
width = 200,
height = 200
)square = easy_draw.Rectangle(xy = (100, 100), width = 200, height = 200)square = easy_draw.Rectangle(
xy = (100, 100),
width = 200,
height = 200
)square = easy_draw.Rectangle((100, 100), 200, 200)square = easy_draw.Rectangle((100, 100), 200, 200, color = "red")square = easy_draw.Rectangle(
xy = (100, 100),
width = 200,
height = 200
)
square.rotate(45)easy_draw.Rectangle(
xy = (100, 100),
width = 200,
height = 200
)easy_draw.Rectangle(
xy = (100, 100),
width = 200,
height = 200
).rotate(45)easy_draw.Rectangle(xy = (100, 100), width = 200, height = 200).rotate(45)127
Gray
255
0
0
Red
0
255
0
Green
0
0
255
Blue
255
255
0
Yellow
Red
Green
Blue
Color
0
0
0
Black
255
255
255
White
127
127
center_xy
REQUIRED (No default)
The center coordinate (x, y) of where to draw the text.
text
"" - empty string
The text you want to display.
color
"black"
RGB tuple color value, hexadecimal color value, or string containing color name can be used.
font
"Arial"
The font family used for the text. Font must be installed on machine to be used.
size
16
The font size of the text.
bold
False
When set to True, it bolds the text.
italic
False
When set to True, it italicizes the text.
underline
False
When set to True, it underlines the text.
strikethrough
False
When set to True, it strikes-out the text.
visible
True
True = Text can be seen.
False = Text cannot be seen.
Property
Default Value
Description
center_xy
REQUIRED
(No default)
The center coordinate (x, y) of where to draw the image.
image
REQUIRED
(No default)
The image file to draw.
Must use the open_image() function to create the required image object.
visible
True
True = Image can be seen.
False = Image cannot be seen.
color = (255, 0, 0)
color = (0, 255, 0)
color = (0, 0, 255)
color = (255, 255, 255)
color = (0, 0, 0)color = "#FF0000"
color = "#00FF00"
color = "#0000FF"
color = "#FFFFFF"
color = "#000000"words = easy_draw.Text(
center_xy = (300,100),
text = "I Love Python",
color = (0, 200, 50), # Optional Property
font = "Times", # Optional Property
size = 32, # Optional Property
bold = True, # Optional Property
italic = True, # Optional Property
underline = True, # Optional Property
strikethrough = True, # Optional Property
visible = True # Optional Property
)pic = easy_draw.open_image("super_cool_image.png")pic = easy_draw.open_image("super_cool_image.png")
img = easy_draw.Image(
center_xy = (300,300),
image = pic
)


Here is a simple example drawing a tree with a rectangle and three triangles. The background is set to sky blue with a hex color value, and the triangles are rotated 30 degrees.
Here is an example of drawing a square and an octagon, then animating them when clicked.
When the square is clicked, it changes color to a new random value and rotates by 10 degrees.
When the octagon is clicked, it changes color to a new random value and rotates by 10 degrees.
Provided by Jackie Lin from Taiwan CSHS (Chung-shan Senior High School)
More examples coming soon!
import easy_draw
easy_draw.load_canvas()
easy_draw.set_canvas_color("#87CEEB")
trunk = easy_draw.Rectangle(
xy = (250, 300),
width = 100,
height = 310,
color = (160, 82, 45)
)
top = easy_draw.RegPolygon(
nsides = 3,
center_xy = (300, 175),
radius = 125,
color = (0, 255, 0)
)
top.rotate(30)
middle = easy_draw.RegPolygon(
nsides = 3,
center_xy = (300, 275),
radius = 175,
color = (0, 255, 0)
)
middle.rotate(30)
bottom = easy_draw.RegPolygon(
nsides = 3,
center_xy = (300, 400),
radius = 250,
color = (0, 255, 0)
)
bottom.rotate(30)
easy_draw.end()import easy_draw
import random
easy_draw.load_canvas()
colors = ["blue", "red", "yellow", "green", "orange", "purple"]
square = easy_draw.Rectangle(
    xy = (100, 100),
    width = 200,
    height = 200
)
def click_square(event):
global square
random_color = random.choice(colors)
square.set_property(color = random_color)
square.rotate(10)
square.event_setup("<Button-1>", click_square)
octagon = easy_draw.RegPolygon(
center_xy = (400, 400),
radius = 100,
nsides = 8
)
def click_octagon(event):
global octagon
random_color = random.choice(colors)
octagon.set_property(color = random_color)
octagon.rotate(10)
octagon.event_setup("<Button-1>", click_octagon)
easy_draw.end()import easy_draw
import math
from shapely import affinity
from shapely.geometry import LineString, Point, Polygon
def out_n_polygon_of_circle(line_1, line_2, n):
its_0 = line_1.intersection(line_2)
its_0_xy = (its_0.x, its_0.y)
poly_xy = [its_0_xy]
for i in range(1, n+1, 1):
its_i = affinity.rotate(its_0, i*360/n, (0, 0))
its_i_xy = (its_i.x, its_i.y)
poly_xy.append(its_i_xy)
return poly_xy
factor = 37
cxy = (0, 0)
r0 = 8*factor
r1 = r0/2
p0_xy = (r1*math.cos(0*math.pi/10), r1*math.sin(0*math.pi/10))
p2_xy = (r1*math.cos(2*math.pi/10), r1*math.sin(2*math.pi/10))
p3_xy = (r1*math.cos(3*math.pi/10), r1*math.sin(3*math.pi/10))
p4_xy = (r1*math.cos(4*math.pi/10), r1*math.sin(4*math.pi/10))
p6_xy = (r1*math.cos(6*math.pi/10), r1*math.sin(6*math.pi/10))
p8_xy = (r1*math.cos(8*math.pi/10), r1*math.sin(8*math.pi/10))
p10_xy = (r1*math.cos(10*math.pi/10), r1*math.sin(10*math.pi/10))
p18_xy = (r1*math.cos(18*math.pi/10), r1*math.sin(18*math.pi/10))
line_p2_p8 = LineString([p2_xy, p8_xy])
line_p2_00 = LineString([p2_xy, (0, 0)])
line_p3_00 = LineString([p3_xy, (0, 0)])
line_p4_00 = LineString([p4_xy, (0, 0)])
its_21 = line_p3_00.intersection(line_p2_p8)
its_22 = affinity.rotate(its_21, 36, (0, 0))
its_23 = affinity.rotate(its_21, 72, (0, 0))
its_21_xy = (its_21.x, its_21.y)
its_22_xy = (its_22.x, its_22.y)
its_23_xy = (its_23.x, its_23.y)
star_edge_xy = [p2_xy, its_21_xy, p4_xy]
star_edge = LineString(star_edge_xy)
its_41 = line_p4_00.intersection(line_p2_p8)
its_41_xy = (its_41.x, its_41.y)
star_edge_xy = [its_21_xy, its_41_xy, its_22_xy]
star_edge = LineString(star_edge_xy)
H_line = LineString([(0, 0), (8*factor, 0)])
r_H_line = affinity.rotate(H_line, 18, cxy)
V_Rline = LineString([(r1, 0), (r1, 8*factor)])
returned_xy_list = out_n_polygon_of_circle(r_H_line, V_Rline, 10)
decagon_xy = returned_xy_list
decagon = LineString(decagon_xy)
line_p0_p6 = LineString([p0_xy, p6_xy])
line_p4_p18 = LineString([p4_xy, p18_xy])
its_1 = r_H_line.intersection(V_Rline)
its_2 = r_H_line.intersection(line_p0_p6)
its_3 = H_line.intersection(line_p4_p18)
its_4 = line_p0_p6.intersection(line_p4_p18)
its_1_xy = (its_1.x, its_1.y)
its_2_xy = (its_2.x, its_2.y)
its_3_xy = (its_3.x, its_3.y)
its_4_xy = (its_4.x, its_4.y)
its_5_xy = (its_1.x, -its_1.y)
its_5 = Point(its_5_xy)
its_6 = affinity.rotate(its_1, -108, its_5_xy)
its_6_xy = (its_6.x, its_6.y)
its_7 = affinity.rotate(its_5, -108, its_6_xy)
its_7_xy = (its_7.x, its_7.y)
its_8 = affinity.rotate(its_6, -108, its_7_xy)
its_8_xy = (its_8.x, its_8.y)
pentagon_line = LineString([its_1_xy, its_5_xy, its_6_xy, its_7_xy, its_8_xy])
pentagon = Polygon([its_1_xy, its_5_xy, its_6_xy, its_7_xy, its_8_xy, its_1_xy])
pentagon_cen = pentagon.centroid
pentagon_cen_xy = (pentagon_cen.x, pentagon_cen.y)
pen_line_5_to_6 = LineString([its_5_xy, its_6_xy])
mid = pen_line_5_to_6.interpolate(0.5, normalized=True)
mid_xy = (mid.x, mid.y)
pen_line_1 = LineString([p0_xy, pentagon_cen_xy])
pen_line_2 = LineString([mid_xy, pentagon_cen_xy])
dart_line_1_extend = affinity.rotate(pen_line_1, -36, p0_xy)
dart_line_2_extend = affinity.rotate(pen_line_2, 36, mid_xy)
its_dart = dart_line_1_extend.intersection(dart_line_2_extend)
its_dart_xy = (its_dart.x, its_dart.y)
dart_xy = [p0_xy, its_dart_xy, mid_xy, pentagon_cen_xy, p0_xy]
dart = LineString(dart_xy)
dart_edge = LineString([p0_xy, its_dart_xy, mid_xy])
dart_edge_1 = LineString([p0_xy, its_dart_xy, mid_xy])
dart_edge_2 = affinity.rotate(dart_edge_1, 72, pentagon_cen_xy)
dart_edge_3 = affinity.rotate(dart_edge_1, 144, pentagon_cen_xy)
dart_edge_4 = affinity.rotate(dart_edge_1, 216, pentagon_cen_xy)
dart_edge_5 = affinity.rotate(dart_edge_1, 288, pentagon_cen_xy)
star_p01 = dart_edge_1.coords[:][0]
star_p02 = dart_edge_1.coords[:][1]
star_p03 = dart_edge_1.coords[:][2]
star_p04 = dart_edge_2.coords[:][1]
star_p05 = dart_edge_2.coords[:][2]
star_p06 = dart_edge_3.coords[:][1]
star_p07 = dart_edge_3.coords[:][2]
star_p08 = dart_edge_4.coords[:][1]
star_p09 = dart_edge_4.coords[:][2]
star_p10 = dart_edge_5.coords[:][1]
star_p11 = dart_edge_5.coords[:][2]
star_xy = [star_p01, star_p02, star_p03, star_p04, star_p05, star_p06, star_p07, star_p08, star_p09, star_p10, star_p11]
star = LineString(star_xy)
pentagon = LineString([its_1_xy, its_5_xy, its_6_xy, its_7_xy, its_8_xy])
easy_draw.load_canvas()
colors = ["black", "blue", "red", "yellow", "green", "orange", "purple"]
cir_r1 = easy_draw.Circle(
center_xy=(300, 300),
radius=r1,
color=(100, 149, 237)
)
r2 = its_2.distance(Point(0, 0))
s01_xy = (r2*math.cos(1*math.pi/10), r2*math.sin(1*math.pi/10))
kite_xy = [p0_xy, its_1_xy, p2_xy, s01_xy]
kite = LineString(kite_xy)
for degree in (0, 36, 72, 108, 144, 180, 216, 252, 288, 324):
r_kite = affinity.rotate(kite, degree, (0, 0))
t_r_kite = affinity.translate(r_kite, 300, 300, 0)
xy_list = []
for xy in t_r_kite.coords[:]:
xy_list.append(xy[0])
xy_list.append(xy[1])
poly_kite = easy_draw.Polygon(points_list=xy_list, color=(153, 50, 204), border_color=colors[0], border_width=2)
out_star_edge_xy = [p2_xy, its_21_xy, p4_xy]
out_star_edge = LineString(out_star_edge_xy)
for i in range(1, 10+1, 1):
r_star_edge = affinity.rotate(out_star_edge, i*36, (0, 0))
t_star_edge = affinity.translate(r_star_edge, 300, 300, 0)
xy_list = []
for xy in t_star_edge.coords[:]:
xy_list.append(xy[0])
xy_list.append(xy[1])
edge_line = easy_draw.Line(points_list=xy_list, thickness=2, color=colors[0], style="cut")
in_star_edge_xy = [its_21_xy, its_41_xy, its_22_xy]
in_star_edge = LineString(in_star_edge_xy)
for i in range(1, 10+1, 1):
r_star_edge = affinity.rotate(in_star_edge, i*36, (0, 0))
t_star_edge = affinity.translate(r_star_edge, 300, 300, 0)
xy_list = []
for xy in t_star_edge.coords[:]:
xy_list.append(xy[0])
xy_list.append(xy[1])
edge_line = easy_draw.Line(points_list=xy_list, thickness=2, color=colors[0], style="cut")
for degree in (0, 36, 72, 108, 144, 180, 216, 252, 288, 324):
r_pentagon_line = affinity.rotate(pentagon_line, degree, (0, 0))
t_r_pentagon_line = affinity.translate(r_pentagon_line, 300, 300, 0)
xy_list = []
for xy in t_r_pentagon_line.coords[:]:
xy_list.append(xy[0])
xy_list.append(xy[1])
poly_petagon = easy_draw.Polygon(points_list=xy_list, color=(173, 216, 230), border_color=colors[0], border_width=2)
r_star = affinity.rotate(star, degree, (0, 0))
t_r_star = affinity.translate(r_star, 300, 300, 0)
xy_list = []
for xy in t_r_star.coords[:]:
xy_list.append(xy[0])
xy_list.append(xy[1])
poly_star = easy_draw.Polygon(points_list=xy_list, color=(255, 215, 0), border_color=colors[0], border_width=2)
dy = 2 * its_1.y
up_tmp = affinity.rotate(its_1, 72, (0, 0))
pentagon_right_tip = affinity.rotate(Point(its_5_xy), 144, pentagon_cen_xy)
up_point_1 = affinity.rotate(pentagon_right_tip, 72, (0, 0))
up_point_1_xy = (up_point_1.x, up_point_1.y)
up_point_2_xy = (-up_point_1.x, up_point_1.y)
up_point_3_xy = (up_tmp.x, up_tmp.y + dy)
up_tri = LineString([up_point_1_xy, up_point_2_xy, up_point_3_xy])
for degree in (0, 36, 72, 108, 144, 180, 216, 252, 288, 324):
r_up_tri = affinity.rotate(up_tri, degree, (0, 0))
t_r_up_tri = affinity.translate(r_up_tri, 300, 300, 0)
xy_list = []
for xy in t_r_up_tri.coords[:]:
xy_list.append(xy[0])
xy_list.append(xy[1])
poly_tri = easy_draw.Polygon(points_list=xy_list, color=(143, 188, 143), border_color=colors[0], border_width=2)
easy_draw.end()Coming soon!


When drawing shapes, the sequence matters. That is how the layering system works.
The first object in sequence that is drawn in your code will be at the bottom most layer of your drawing. The last object in sequence that is drawn in your code will be the top most layer of your drawing.
Rectangle(xy, width, height)
Example:
RegPolygon(nsides, center_xy, radius)
Example:
Polygon(points_list)
The above image is just an example. The Polygon can have as many sides as you want, and is dependent on the number of xy coordinates you provide.
The points_list property MUST have an even number of values. It must consist of xy pairs for each point.
Example:
Line(xy1, xy2)
OR
Line(points_list)
Example:
Circle(center_xy, radius)
Example:
Oval(center_xy, width, height)
Example:
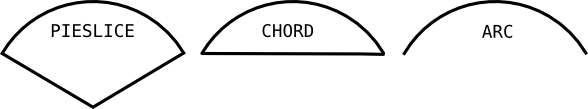
Arc(center_xy, width, height, sweep_angle)
There are 3 different styles:
Note: The "arc" style uses the border_color and border_width only.
Example:

border_color
None
Color of the border.
border_width
0
Size of the border in pixels.
dashes
None
Size of the dashes for the border in pixels.
visible
True
True = Shape can be seen.
False = Shape cannot be seen.
RGB tuple color value, hexadecimal color value, or string containing color name can be used.
border_color
None
Color of the border.
border_width
0
Size of the border in pixels.
dashes
None
Size of the dashes for the border in pixels.
visible
True
True = Shape can be seen.
False = Shape cannot be seen.
Size of the border in pixels.
dashes
None
Size of the dashes for the border in pixels.
visible
True
True = Shape can be seen.
False = Shape cannot be seen.
RGB tuple color value, hexadecimal color value, or string containing color name can be used.
thickness
5
The width of the line.
dashes
None
Size of the dashes for the border in pixels.
arrow_start
False
Add an arrow to the start of the line.
arrow_end
False
Add an arrow to the end of the line.
style
"round"
Set property to "round" for round edges and joints and "cut" for squared/cut-off edges and joints.
visible
True
True = Shape can be seen.
False = Shape cannot be seen.
Color of the border.
border_width
0
Size of the border in pixels.
dashes
None
Size of the dashes for the border in pixels.
visible
True
True = Shape can be seen. False = Shape cannot be seen.
RGB tuple color value, hexadecimal color value, or string containing color name can be used.
border_color
None
Color of the border.
border_width
0
Size of the border in pixels.
dashes
None
Size of the dashes for the border in pixels.
visible
True
True = Shape can be seen.
False = Shape cannot be seen.
The amount of the arc to show. From 0 to the angle in degrees identified.
color
"black"
RGB tuple color value, hexadecimal color value, or string containing color name can be used.
border_color
None
Color of the border.
border_width
0
Size of the border in pixels.
dashes
None
Size of the dashes for the border in pixels.
style
"pieslice"
The arc comes in three styles choices: "pieslice", "chord", and "arc"
visible
True
True = Shape can be seen. False = Shape cannot be seen.
Property
Default Value
Description
xy
REQUIRED (No default)
The x and y coordinate of the rectangle's top-left corner as a tuple.
width
REQUIRED (No default)
The width of the rectangle in pixels.
height
REQUIRED (No default)
The height of the rectangle in pixels.
color
"black"
Property
Default Value
Description
nsides
REQUIRED (No default)
The number of sides the polygon has.
center_xy
REQUIRED (No default)
The x and y coordinate of the polygon's center as a tuple.
radius
REQUIRED (No default)
The distance in pixels from the center to any outer point.
color
Property
Default Value
Description
points_list
REQUIRED (No default)
A list of x y coordinates identifying the points of the polygon. List must have an even number of values.
color
"black"
RGB tuple color value, hexadecimal color value, or string containing color name can be used.
border_color
None
Color of the border.
border_width
Property
Default Value
Description
xy1
REQUIRED if points_list is not provided (No default)
The starting xy coordinate of the line as a tuple.
xy2
REQUIRED if points_list is not provided (No default)
The ending xy coordinate of the line as a tuple.
points_list
REQUIRED is xy1 and xy2 are not provided (No default)
A list of x y coordinates identifying the points of the line. List must have an even number of values.
color
Property
Default Value
Description
center_xy
REQUIRED (No default)
The center coordinate (x, y) of the circle.
radius
REQUIRED (No default)
The measurement in pixels from the center of the circle to the edge.
color
"black"
RGB tuple color value, hexadecimal color value, or string containing color name can be used.
border_color
Property
Default Value
Description
center_xy
REQUIRED (No default)
The center coordinate (x, y) of the oval.
width
REQUIRED (No default)
The measurement in pixels of the left edge to the right edge of the oval.
height
REQUIRED (No default)
The measurement in pixels of the top edge to the bottom edge of the oval.
color
Property
Default Value
Description
center_xy
REQUIRED (No default)
The center coordinate (x, y) of the circle used to create the arc.
width
REQUIRED (No default)
The width of the circle used to create the arc.
height
REQUIRED (No default)
The height of the circle used to create the arc.
sweep_angle
RGB tuple color value, hexadecimal color value, or string containing color name can be used.
"black"
0
"black"
None
"black"
REQUIRED (No default)


rect1 = easy_draw.Rectangle(
    xy = (300, 300),
    width = 200,
    height = 150,
    color = (255, 0, 0),          # Optional Property
    border_color = (0, 0, 0),     # Optional Property
    border_width = 10,            # Optional Property
    dashes = 25                   # Optional Property
    visible = True                # Optional Property
)reg_poly1 = easy_draw.RegPolygon(
nsides = 8,
center_xy = (300, 300),
radius = 100,
color = (255, 0, 0), # Optional Property
border_color = (0, 0, 0), # Optional Property
border_width = 10, # Optional Property
dashes = 25 # Optional Property
)poly1 = easy_draw.Polygon(
points_list = [25, 25, 150, 25, 200, 200, 100, 250, 25, 200],
color = (255, 0, 0), # Optional Property
border_color = (0, 0, 0), # Optional Property
border_width = 10, # Optional Property
dashes = 25 # Optional Property
)line1 = easy_draw.Line(
xy1 = (100, 100),
xy2 = (200, 200),
thickness = 8, # Optional Property
color = (255, 0, 0), # Optional Property
dashes = 25 # Optional Property
)
# OR
line1 = easy_draw.Line(
points_list = [],
thickness = 8, # Optional Property
color = (0, 255, 0), # Optional Property
dashes = 25, # Optional Property
style = "cut" # Optional Property
)cir1 = easy_draw.Circle(
center_xy = (300, 300),
radius = 100,
color = (255, 0, 0), # Optional Property
border_color = (0, 0, 0), # Optional Property
border_width = 10, # Optional Property
dashes = 25 # Optional Property
)oval1 = easy_draw.Oval(
center_xy = (300, 300),
width = 100,
height = 200,
color = (255, 0, 0), # Optional Property
border_color = (0, 0, 0), # Optional Property
border_width = 10, # Optional Property
dashes = 25 # Optional Property
)arc1 = easy_draw.Arc(
center_xy = (300, 300),
width = 100,
height = 100,
sweep_angle = 90,
style = "chord", # Optional Property
color = (255, 0, 0), # Optional Property
border_color = (0, 0, 0), # Optional Property
border_width = 10, # Optional Property
dashes = 25 # Optional Property
) 


Easy Draw is just a Tkinter GUI window. It has all the capabilities of any Tkinter app.
You can modify or add to Easy Draw's Tkinter window by referencing the Easy Draw variable easy_draw.WINDOW
You can modify or add to Easy Draw's canvas by referencing the Easy Draw variable easy_draw.CANVAS